February 10 - February 14, 2020
I Can:
Save an entire project to a folder.
Illustrate and insert clip art, pictures, sound (both voice and music), etc. to make your story fun and unique.
Layer and add complex animations, and transitions.
Explore the Internet for royalty free images and music.
Cite images/music that are not royalty free.
ISTE Standards
1. Creativity and innovation- Students demonstrate creative thinking, construct knowledge, and develop innovative products and processes using technology.
2. Communication and collaboration- Students use digital media and environments to communicate and work collaboratively, including at a distance, to support individual learning and contribute to the learning of others.
4. Critical thinking, problem solving, and decision making- Students use critical thinking skills to plan and conduct research, manage projects, solve problems, and make informed decisions using appropriate digital tools and resources.
Vocabulary
Animation, slide, transition, plagiarism, layer, relative to path, illustrator, author, text.
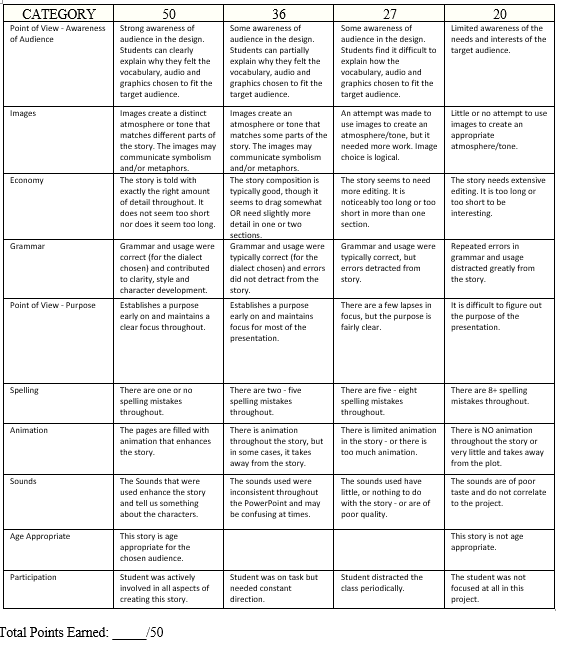
Criteria: You will create a storybook of your choice for young children, grades Pre-K-4. You may decide to choose your own topic, or use a pre-written story and add your own twist. Please use the information below as a reference of items that must be included into your PowerPoint.
****Important Please Read!!!**** Plagiarism is illegal. If you chose to use graphics found from the web, your best bet is using royalty-free images from
https://pixabay.com/ or http://www.clker.com/
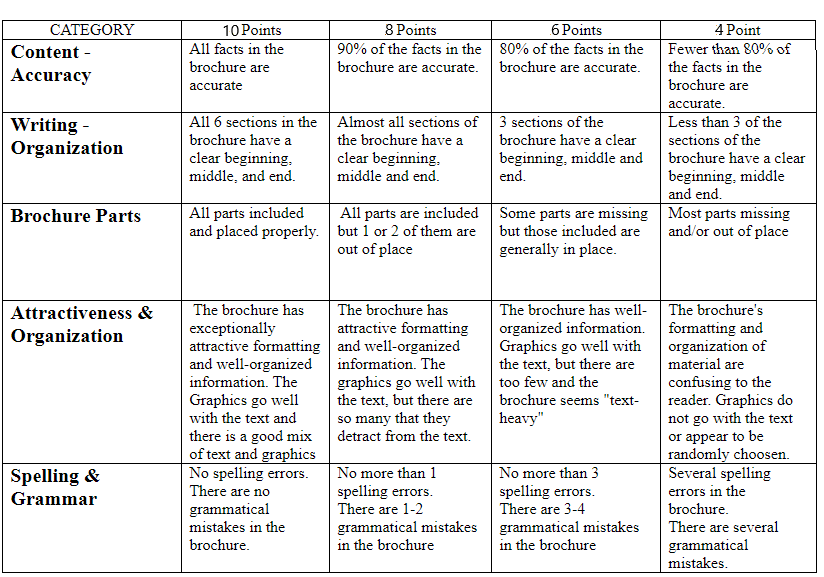
Grading- You will be graded based on the above criteria, along with:
- Title page- first slide.
- Story- beginning, middle and end.
- Your topic must be age appropriate.
- And of course- appropriate colors, text, images, etc.
- Sounds
- Animations on every slide
- 15 slide minimum
- A “My References” slide
****Important Please Read!!!**** Plagiarism is illegal. If you chose to use graphics found from the web, your best bet is using royalty-free images from
https://pixabay.com/ or http://www.clker.com/
Grading- You will be graded based on the above criteria, along with:
- Correct spelling and grammar
- Good use of color
- Good use of text
- Good use of images (must relate to story)
- Your story enhances learning to the appropriate age group
January 31- February 7, 2020
I CAN STATEMENT:
know the difference between a cell, row and column
calculate numbers using a spreadsheet
KEY VOCABULARY
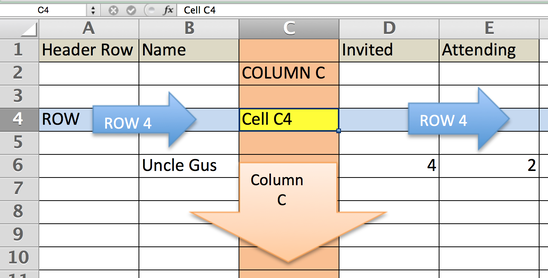
Column: A column runs vertically (or up and down) in a spreadsheet.
Row: A row runs horizontally (across) in a spreadsheet.
Cell: A cell is the intersection point between a column and row. It is the basic storage unit for data.
Header row: A header row is a row containing labels that identify the data in the cells below. It can also be a column with numbers that identify each row.
Format: To format is to change the formatting of the cell number without changing the number itself. (e.g., font size, font border)
Insert: To insert is to add data to cells.
Merge: To merge is to turn two or more cells into one cell.
Sum: The sum is the function of adding numbers in a spreadsheet. (=sum)
Count: The count is the function of totaling the number of cells in a selected range that contain a specific type of data. (=count)
Max: Max is the function of finding the largest or maximum number in a given list of values. (=max)
Min: Min is the function of finding the smallest or minimum number in a given list of values. (=min)
Average: Average is the function of finding the average value, or arithmetic mean, of values in a selected range of cells. (=average)
Chart: Charts are visual representations of worksheet data. Charts often make it easier to understand the data in a worksheet because users can easily pick out patterns and trends illustrated in the chart that are otherwise difficult to see.
Select: Select is the action where you use the mouse (or alternate) to click on a particular cell, image, or object on the screen.
Assignment:
(MAKE SURE TO LABEL EACH PART OF THIS ASSIGNMENT WHEN ADDING IT TO YOUR WEBSITE.)
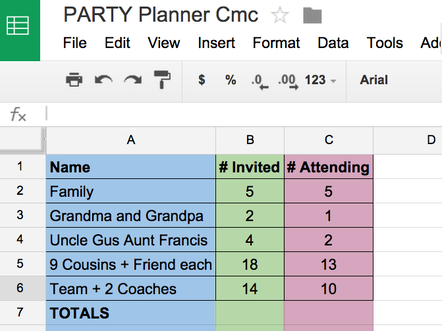
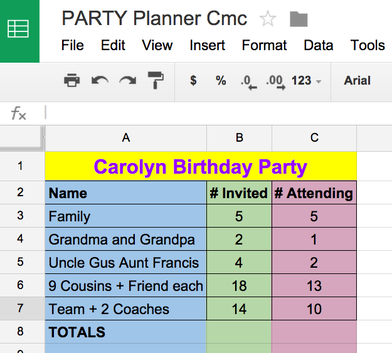
Imagine you are having a celebration and you are inviting guests to your party. There are five people in your family and all five will be attending. You have invited Grandpa and Grandma, but Grandpa is out of town fishing that day, so only Grandma can attend. Aunt Lucy has five people in her family and three will be attending. Uncle Gus and Aunt Francis have four in their family, but only two can attend that day. You also want to invite all nine of your cousins and you have let them know they can bring a friend, so 13 people will be attending. In addition, you can't forget all 12 members on your Ping Pong team plus the two coaches so an additional 10 people will be attending.
You could use a spreadsheet to keep track of the data for you and automatically calculate numbers. We are going to start with a simple spreadsheet that uses a basic SUM formula. Before beginning you will need to know and understand the words cell, row and column. See image below for guidance:
You could use a spreadsheet to keep track of the data for you and automatically calculate numbers. We are going to start with a simple spreadsheet that uses a basic SUM formula. Before beginning you will need to know and understand the words cell, row and column. See image below for guidance:
Step 1 - Open a new Spreadsheet and name it: Party Planner.
Step 2 - Title three columns: Name, # Invited, # Attending (make sure all of the titles are capitalized). This is called a Header Row.
Step 3 - List all of the families, neighbors, and groups invited under NAME. You will need to adjust the column width to fit the names of the people invited.
Step 4 - List the number of people invited under # INVITED
Step 5 - List the number of people attending under # ATTENDING
Step 6 - Screenshot your Spreadsheet and add it as a SUB PAGE that falls under the Microsoft Excel Page; Title this new page Party Planner
Part 2
Step 1 - Open the existing Party Planner spreadsheet.
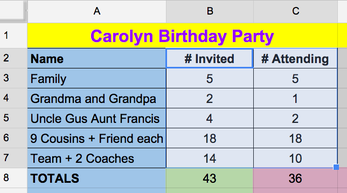
Step 2 - Align the text for column B and C so it is in the center.
Step 3 - Select column A and color it light blue, select column B and color it light green, and select column C and make it light pink.
Step 4 - Put a border around each cell.
Step 5 - Have a row labeled TOTALS below the last name and make it bold.
Step 6 - Make the header row bold.
Step 7 - "Fit" the column to the content with a double-click on the line between the columns
Part 3
Step 1 - Select row 1, go to INSERT on the menu bar and select ROW ABOVE
Step 2 - In Cell A1 put your name and the type of party you are planning.
Step 3 - Select Cells A1, B1, and C1.
Step 4 - Click on the Merge Cells Button.
Step 5 - Make the font for this row size 14, change the font color to blue, and align center.
Step 6 - Screenshot your Spreadsheet and add it to your Party Planner Page
Part 4
Take the quiz
https://www.proprofs.com/quiz-school/story.php?title=mte3nzm4nah3mr
Add the results to the Party Planner Page as a screenshot
Part 5
Using a Formula to Add a Column
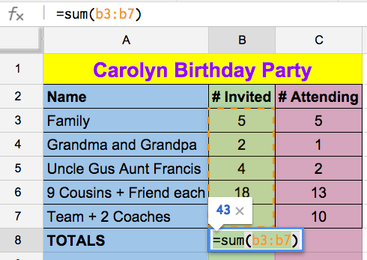
Step 1 - Put an addition formula in the B column below the last number of invitees. Our example is using B8. The formula should look like one of these: =B3+B4+B5+B6+B7 or = SUM(B3:B7) Notice B3 is the cell for the first number of invited guests, and B7 is the last cell with a number of invited guests. So we want to add all the numbers in the cells starting with B3 down to B7 (B3:B7) After you enter the formula, click on Return or Enter, and the total will appear instead of the formula.
Step 2 - Put an addition formula in column C below the last number of people attending. The process is the same as above. You may also experiment with using the FUNCTIONS button on the toolbar.
Step 3 - When you click off of the formula it should automatically add the numbers.
Step 4 - View the formulas in your spreadsheet go to VIEW in the menu and select ALL FORMULAS. This shows you all of the formulas on the sheet.
Step 5 - Take a screen shot of your spreadsheet with ALL FORMULAS showing. Ask your SSI chief if they want you to share it with them.
Step 6 - To not see all of the formulas go back to VIEW in the menu and select ALL FORMULAS and it will return to numbers in the columns.
Part 6
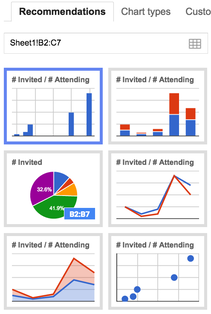
Step 1 – What data will you choose? To create a chart we have to first decide what to include. Let's start by including the headings #Invited and #Attending and the numbers (our data). Looking at our chart, we want to select cell B2 and all the data below (but not the totals), and C2 and all the data below that. In our example we will select B2 all the way to the last cell of data in column C which is C7 (shown in the white area). There are a couple of ways to "select" all these cells. 1. Click in B2 and holding your mouse, drag down to C7 and let up. 2. You can also click in B2, hold down the shift key, then click in cell C7 (you decide which works best)
Step 2 – Create the Chart Select the chart icon on the tool bar if it is showing, or click on the More button to show it (you can also use the INSERT Menu and then CHART from that menu). You will see your data in several different chart examples that are "recommended" by Google. Take a moment to look at each one and decide which one shows the comparison of numbers invited to attending that makes the most sense to you. Discuss the differences with others or as a class. Choose the type of chart that you feel will display the information the best, click on it, and click on the Insert button. Make it smaller on your page by clicking and dragging in on one of the corners of the chart diagram. You can also move it next to, or underneath your data table. To delete it, click on it to select it and hit your backspace or delete key. Then try a different type of chart following the same steps.
Step 3 – Name the Chart Select your chart by clicking once on it, and then click on the drop down arrow to CUSTOMIZE it and select Advanced Edit (you are now in the Customization section). Type a name for your chart in the Title box (Party Planning). Then change the size of the font for the Legend to 8. Click on the Update button when done.
Step 4 - Screenshot your Spreadsheet and add it to your Party Planner Page
Excel Support:
https://support.google.com/docs/answer/46977?hl=en&topic=20433&ctx=topic&visit_id=637160802884498500-2980669091&rd=1
https://support.google.com/docs/answer/46977?hl=en&topic=20433&ctx=topic&visit_id=637160802884498500-2980669091&rd=1
https://edu.gcfglobal.org/en/excel2010/creating-simple-formulas/1/
http://www.gcflearnfree.org/office2010/excel2010/9
https://www.youtube.com/watch?v=rwbho0CgEAE
January 15 - 29, 2020
We have explored Microsoft Publisher and Microsoft Word. We are now going to explore Microsoft Excel.You will need a partner for this activity. You will also need to create a new page on your website titled Microsoft Excel.
1. Download the Spinner Template
| spinner_template.xls |
2. Work with a partner.
- Spreadsheet Operator: Open the spreadsheet and save it with your name and spinner in the title ready to use.
- Spinner: Open a blank document (word processing or presentation program) to input screenshots and answers to the questions posed as you go through this Spinner Project.
- Analyst: Your partner(s) will read the directions for each step and help analyze the data.
3. The spinner member of the group will go to this interactive spinner to simulate the colors at the Superb Slushie Company. The spreadsheet operator will record the data into the spreadsheet.
4. Spinner - Look under the online spinner, click on the "Results" button to see the chart on the right, then enter the number 20 in the Spins box.
5. Click on "spin" button to see the results graphed. Notice the numbers in each bar indicate how many times the spinner landed on that color out of the 20 times it spun.
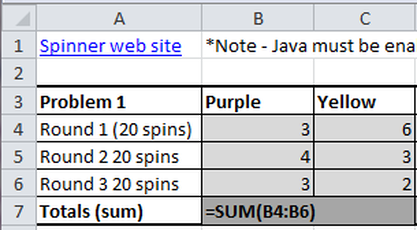
6. The spreadsheet operator should record the results in the Problem One section of the spreadsheet, as called off by the spinner partner, example shown below.Spinner - When the operator is done, click the CLEAR button on the grid.
7. Spinner - Spin the spinner another time and the Operator will record the results.
The Spinner should click on "CLEAR" to clear the results, and do these steps one last time so that you have three sets of results entered in your spreadsheet.
4. Spinner - Look under the online spinner, click on the "Results" button to see the chart on the right, then enter the number 20 in the Spins box.
5. Click on "spin" button to see the results graphed. Notice the numbers in each bar indicate how many times the spinner landed on that color out of the 20 times it spun.
6. The spreadsheet operator should record the results in the Problem One section of the spreadsheet, as called off by the spinner partner, example shown below.Spinner - When the operator is done, click the CLEAR button on the grid.
7. Spinner - Spin the spinner another time and the Operator will record the results.
The Spinner should click on "CLEAR" to clear the results, and do these steps one last time so that you have three sets of results entered in your spreadsheet.
|
Part 2
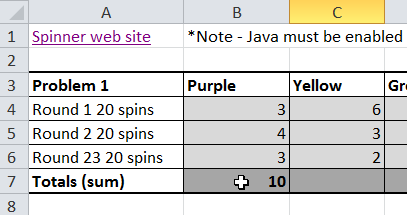
Your next step is to use a formula to have the spreadsheet add up the totals for you. You can do this by using the SUM function on the right. In the spreadsheet, put your cursor in the Total row under the Purple column (cell B7 in the example shown). Type this formula into the cell to have it add up the numbers in cells in that column that are in B4 + B5 + B6. To do this you would first enter =SUM (This tells the spreadsheet that you want to see the results of the formula that will follow). Following =SUM you should enter (B4:B6). This is the formula that tells the spreadsheet to add the numbers in the cells from B4 through B6. It should look like this: =SUM(B4:B6). After entering this formula, hit enter on your keyboard. This should put the total for how many times the spinner landed on Purple in the total cell for Purple. Help with Sums:
|
|
Find the totals for the other colors using the same formula. Remember that the numbers for the other colors are in different columns, so the letters in the formulas will change; Yellow is in column C, for example.
Part 3 Analysis, Prediction, and Global Results
Since all the color parts of the spinner are equal sizes, do you think that if you spin the spinner more times, that the results should be closer to an equal number of hits for each color?
3.1. Discuss this with your partner and make your prediction.
3.2. Now change the number of spins to 40 and repeat this same process as before, filling in the information into the Problem Two section.
How many times did one, three, and five (prime numbers) occur in the global survey results? Why would this number be different from spinning the spinner 200 times?
3.6. Document your predictions to the following scenario based on your data in your Spinner Report document:
Since all the color parts of the spinner are equal sizes, do you think that if you spin the spinner more times, that the results should be closer to an equal number of hits for each color?
3.1. Discuss this with your partner and make your prediction.
3.2. Now change the number of spins to 40 and repeat this same process as before, filling in the information into the Problem Two section.
- Take some screenshots as you work and paste them into a word processing or presentation program to use later on.
- Be sure to make some notes about what you were doing with each screenshot to reference later on in your final Spinner Project report.
- Now one person from each team should click this survey link and enter your results into the global survey.
- The number of total results collected in the global survey.
- In your own results, how close were your results to the total survey results?
- As more students enter their results into the global survey, what do you expect to happen to the totals for each color?
How many times did one, three, and five (prime numbers) occur in the global survey results? Why would this number be different from spinning the spinner 200 times?
3.6. Document your predictions to the following scenario based on your data in your Spinner Report document:
- If you walked into the Slushie store with five friends and you each spun the wheel for a slushie, what color or colors would you expect each of you to receive?
- Use the data you collected to predict and then compare with two other groups
- Defend how your data supports your answer
- Do all of you agree on the answers? Why or why not?
- Discuss your answers with your classmates
Screenshot ALL documents and add them to your Microsoft Excel page.
January 7, 2020
Please complete the following survey.
https://surveys.panoramaed.com/detroit/login
STEP 1: GO TO surveys.panoramaed.com/detroit
STEP 2: ENTER 6-9 DIGIT STUDENT ID as ACCESS CODE
https://surveys.panoramaed.com/detroit/login
STEP 1: GO TO surveys.panoramaed.com/detroit
STEP 2: ENTER 6-9 DIGIT STUDENT ID as ACCESS CODE
December 11, 2019 - January 17, 2020
After learning Microsoft Word and all its features, let's look at Citations, Plagiarism, and Research papers.
The temptation to copy and paste content from the Internet is a reality for many people. Without proper citation of the work this practice is unethical, dishonest, and illegal. One way to check your work for original content rather than plagiarism is to utilize a plagiarism checker. We will be checking content you copy from the Internet as well as your own work for originality vs. plagiarism.
Create a New Page on your website titled Citations/Plagiarism. Add everything you do in this lesson to this page. Make sure you screenshot your work and results and add them to this page.
To begin this lesson, let's view the video located at the website below:
https://www.easybib.com/guides/video-lesson-citations-for-beginners/
Materials:
Internet access
Large poster paper
Markers/colored pencils
“Evaluating Sources Group Activity” Sheet
1. List what you think you should look for when deciding if a webpage is dependable enough to use as a source.
2. Form groups of 3-4 students.
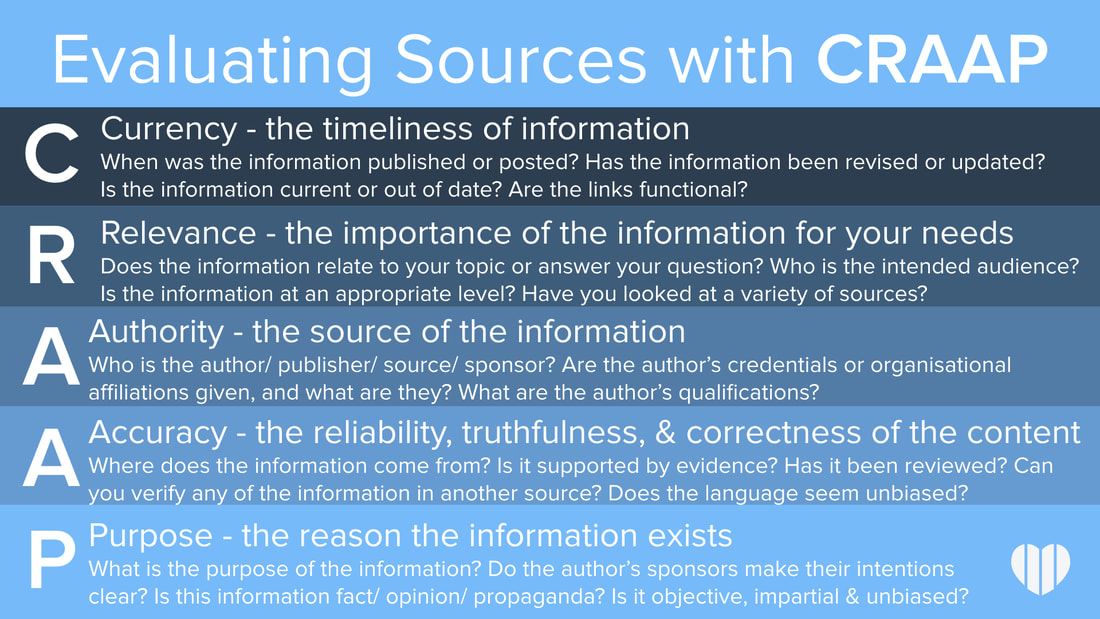
3. Follow the instructions on the “Evaluation Sources Group Activity” handout. Create a visual that explains how to properly evaluate a source. The visual should be informative and creative – no boring circle maps! Ideas: Use a tree with “evaluating sources” written on the trunk - the branches being the criteria and the leaves being supporting information. Design a road map where the destination is being able to evaluate a source properly. Whatever your group decides, your design needs to be well-thought out to include all of the necessary information in an eye-catching way. The title needs to relate somehow to evaluating sources:
4. Your group will present their posters to the class. Discuss the validity of the website(s). It is also interesting to show other websites that were not evaluated to demonstrate the silly sites that can be found online. DO NOT use sites like Wikipedia or Answers.com because they can be changed or answered by the general public.
5. Homework: Thoroughly explain how to evaluate a source to someone who has no idea how to do it. (8 to 10 sentences)
6. You will be using the information on your posters to actually evaluate a site. There are plenty of fake websites online. Check out this site dhmo.org for
dihydrogen monoxide, which is simply water.) Select a pen color not used already on your map. For each criteria on your map, write in the corresponding information from the assigned site with the new pen/marker color. Thus, for “Authority,” write the author’s name. If there is no author, write "NO" to indicate there is no author. Do this for each criteria.
Internet access
Large poster paper
Markers/colored pencils
“Evaluating Sources Group Activity” Sheet
1. List what you think you should look for when deciding if a webpage is dependable enough to use as a source.
2. Form groups of 3-4 students.
3. Follow the instructions on the “Evaluation Sources Group Activity” handout. Create a visual that explains how to properly evaluate a source. The visual should be informative and creative – no boring circle maps! Ideas: Use a tree with “evaluating sources” written on the trunk - the branches being the criteria and the leaves being supporting information. Design a road map where the destination is being able to evaluate a source properly. Whatever your group decides, your design needs to be well-thought out to include all of the necessary information in an eye-catching way. The title needs to relate somehow to evaluating sources:
4. Your group will present their posters to the class. Discuss the validity of the website(s). It is also interesting to show other websites that were not evaluated to demonstrate the silly sites that can be found online. DO NOT use sites like Wikipedia or Answers.com because they can be changed or answered by the general public.
5. Homework: Thoroughly explain how to evaluate a source to someone who has no idea how to do it. (8 to 10 sentences)
6. You will be using the information on your posters to actually evaluate a site. There are plenty of fake websites online. Check out this site dhmo.org for
dihydrogen monoxide, which is simply water.) Select a pen color not used already on your map. For each criteria on your map, write in the corresponding information from the assigned site with the new pen/marker color. Thus, for “Authority,” write the author’s name. If there is no author, write "NO" to indicate there is no author. Do this for each criteria.
| evaluating_sources_group_activity_sheet.docx |

1. Visit http://www.biography.com/people/martin-luther-king-jr-9365086 to find information on Martin Luther King Jr.
Martin Luther King Jr. Photographed by Marion S. Trikosko, 1964. LC-DIG-ppmsc-01629 Source: Library of Congress
Martin Luther King, Jr.
Martin Luther King, Jr. photographed by Marion S. Trikosko, 1964. LC-DIG-ppmsc-01269 Source: Library of Congress - See more at: http://www.mlkonline.net/images.html#sthash.BB608Qmy.dpuf
Martin Luther King, Jr. photographed by Marion S. Trikosko, 1964. LC-DIG-ppmsc-01269 Source: Library of Congress - See more at: http://www.mlkonline.net/images.html#sthash.BB608Qmy.dpuf
Martin Luther King, Jr. photographed by Marion S. Trikosko, 1964. LC-DIG-ppmsc-01269 Source: Library of Congress - See more at: http://www.mlkonline.net/images.html#sthash.BB608Qmy.dpuf
2. Copy the synopsis.(a brief summary or general survey of something.)
3. Now let's check this information for original content.
4. Visit http://www.paperrater.com/plagiarism_checker and paste the copied content into the text box. Agree to the terms of service by checking the box and then click on get report.
5. When results are completed, take a screen shot of the results box.
6. In a Microsoft Word document, reflect on the following questions:
- Show the percentage of originality by pasting the screenshot and reflect on what the results tell you?
- Now find a document you have created and check it for plagiarism using the PaperRater. Show the percentage of originality by pasting the screenshot (in same word doc as above) and reflect on what the results tell you. Do you have any original content or have you possibly copied some from the Internet?
- Now that you have checked two documents for original content, add a paragraph to your current document on why sites such as PaperRater exist and why it could benefit you in the future?
December 2 - December 6, 2019
Finish the Microsoft Word Assignment. When it is complete, Screenshot the screen crop it in Paint and Post it to your Microsoft Word Page on your Website.
November 20 - November 26, 2019
Please Open the document and complete the steps.
| microsoft_word_editing_assignment.docx |
November 5, 2019 - November 8, 2019
You have learned how to create using Microsoft Publisher. Now let's look at Microsoft Word. You will be working split screen. You will start with the following website
https://edu.gcfglobal.org/en/word/ Begin at 1 and go to 30. You will be looking at Word as you go through each section. Once you have completed each section, take the quiz
When your score appears on the screen, PrtScr (Screenshot) and save it in Paint and post it to your website under a new page titled Microsoft Word. Publish once you are done.
October 25, 2019- November 5, 2019
You've learned about Cyber Safety. Read different articles. Watched videos. Created a brochure. You should be very aware of the dangers of not being safe when using the Internet!
Now your assignment. You will create a Word Cloud using words you've learned from this lesson. Select 30 or more words and you will create a Word Cloud with the words. Use one of the following websites to create the cloud. https://www.wordclouds.com/ https://www.jasondavies.com/wordcloud/ https://wordart.com/create http://www.wordle.net/ https://worditout.com/word-cloud/create
Once you have created your cloud, screenshot it and add it to your website under a new page titled Word Cloud. I showed you how to clean up your screenshots, so please make sure yours looks nice.
It is due at the end of the hour.
Welcome!!!!!!
Have you practiced your keyboarding yet today?
Technique, technique, technique! If you practice correct technique, then the accuracy and speed will continue to improve. 6th grade goal - by the end of the year, can you type (correctly) 30 wpm (words per minute)? 7th grade goal - by the end of the year, can you type (correctly) 35 wpm (words per minute)? 8th grade goal - by the end of the year, can you type (correctly) 40 wpm (words per minute)? Click on the Games page and practice! You can do it!!
Technique, technique, technique! If you practice correct technique, then the accuracy and speed will continue to improve. 6th grade goal - by the end of the year, can you type (correctly) 30 wpm (words per minute)? 7th grade goal - by the end of the year, can you type (correctly) 35 wpm (words per minute)? 8th grade goal - by the end of the year, can you type (correctly) 40 wpm (words per minute)? Click on the Games page and practice! You can do it!!
October 4-11, 2019
SOME TIPS FOR ONLINE SAFETY (safeteens.com and blogsafety.com)
#1 - BE HONEST ABOUT YOUR AGE: Membership rules are there to protect people. For example: if you are under 13, you should not have a Facebook account. If you are too young to sign up, do not lie about your age.
#2 - BE AS ANONYMOUS AS POSSIBLE: Avoid posting anything that could enable a stranger to locate you (your last name, name of your school, sports team, your town, area you 'hang out' in, etc.).
#3 - PHOTOS - THINK BEFORE POSTING: What you upload on the Internet can be downloaded by anyone... anyone! They can pass it around and/or own that posting forever - even if you don't want it on the Internet anymore. Avoid posting pictures that allow people to identify you - do not post pictures of other people (ask them first). Before uploading a photo, think about how you would feel it it were seen by your parent(s), grandparent(s), future employer, etc.
#4 - CHECK COMMENTS REGULARLY: If you allow them on your profile or blog, check them often. Do not respond to mean or embarassing comments... delete them! If possible, block offensive people from commenting further.
#5 - PROTECT YOUR INFORMATION: Check to see if your serve has a 'friends' list that allows you to control who can visit your profile or blog. If so, allow only people you know (in the real world) and trust. If you don't use privacy features, anyone can see your information, including people with bad intentions.
#6 - AVOID IN-PERSON MEETINGS: Do not get together with someone you "meet" in a profile or blog. It is not risk-free, but if you plan to meet with someone you have met online, it should be in a public place and with your parents - please note, this could be a dangerous situation!! People online are not always who they say they are!!!!
Take the "Facts About Cyberbullying" quiz... click here!
Take the "Dealing with Cyberbullying" quiz... click here!
Take the "Addressing Cyberbullying" quiz... click here!
Passwords are important! You want a strong password. You need a system or a strategy for deciding your password for each account or program you have/use. Watch the video, "Creating Passwords" ... click here!
Here is another way to create strong passwords, think through what would work best for you. Watch "How to Create a Strong Password" ... click here!
Here are the top 10 most common passwords, is one of them your password? Watch the video, "10 Most Common Passwords" ... click here!
Passphrases and Passwords - what is your strategy or system for creating your passwords? Never use the same password. Watch the video, "How to Make Passwords Secure" ... click here!
Check out this video! Did you know that people can track you down to the very spot where your picture was taken? Click here to learn more about this... click here! For even more information regarding this same topic, click here!
Click here to watch, "Internet Dangers - Everyone Knows Sarah" ... click here!
Click here to watch, "Think Before You Post" ... click here!
Click here to watch, "Oversharing: Think Before You Post" ... click here!
Click here to watch, "Ten Questions You Should Ask Before You Post" ... click here (video ends at 4:02)
Click here to watch, "Share With Care" ... lots of good reminders... click here!
Click here to watch, "Computer Security" ... click here!
Click here to watch, "Stand Up to Cyberbullying" ... click here!
Assignment
Being safe on the Internet is important for everyone and they should have good information on ways to be safe on the Internet and how to handle certain situations. Your assignment is to use Microsoft Publisher to create a tri-fold brochure for your fellow students at Bates Academy to inform them about how to be safe on the internet.
Brochure must include (but NOT limited to): • Your OWN definition of Internet Safety & tell why it is important • At least 3 Statistics on Internet Safety • At least 5 Safety Tips • At least 3 graphics/pictures • At least 3 dangers or consequences
Suggested Topics/Sections to talk about in your brochure • Your online Identity, Avoid giving out personal information, Incriminating/Unflattering information and pictures • Social Networking • Did you know… (a section with facts) • Cyberbullying, Online Predators, Cell Phones, Gaming
You will be graded on the content and also how visually pleasing and effective your brochure is….